เหมาะสำหรับ
- เริ่มจากพรอมต์ที่มีโครงสร้างและใช้ซ้ำได้ แทนที่จะเป็นแชทเปล่า
- ปรับพรอมต์ให้เข้ากับข้อมูลของคุณ โดยยังคงเจตนาเดิมไว้
- เวิร์กโฟลว์ที่เกี่ยวข้องกับ Finance & Investing
สร้างแดชบอร์ดการเงิน HTML/JS แบบโต้ตอบที่ทำงานได้ในตัวเองสำหรับหุ้นหรือ ETF ที่ระบุ พร้อมดีไซน์โหมดมืดระดับมืออาชีพ
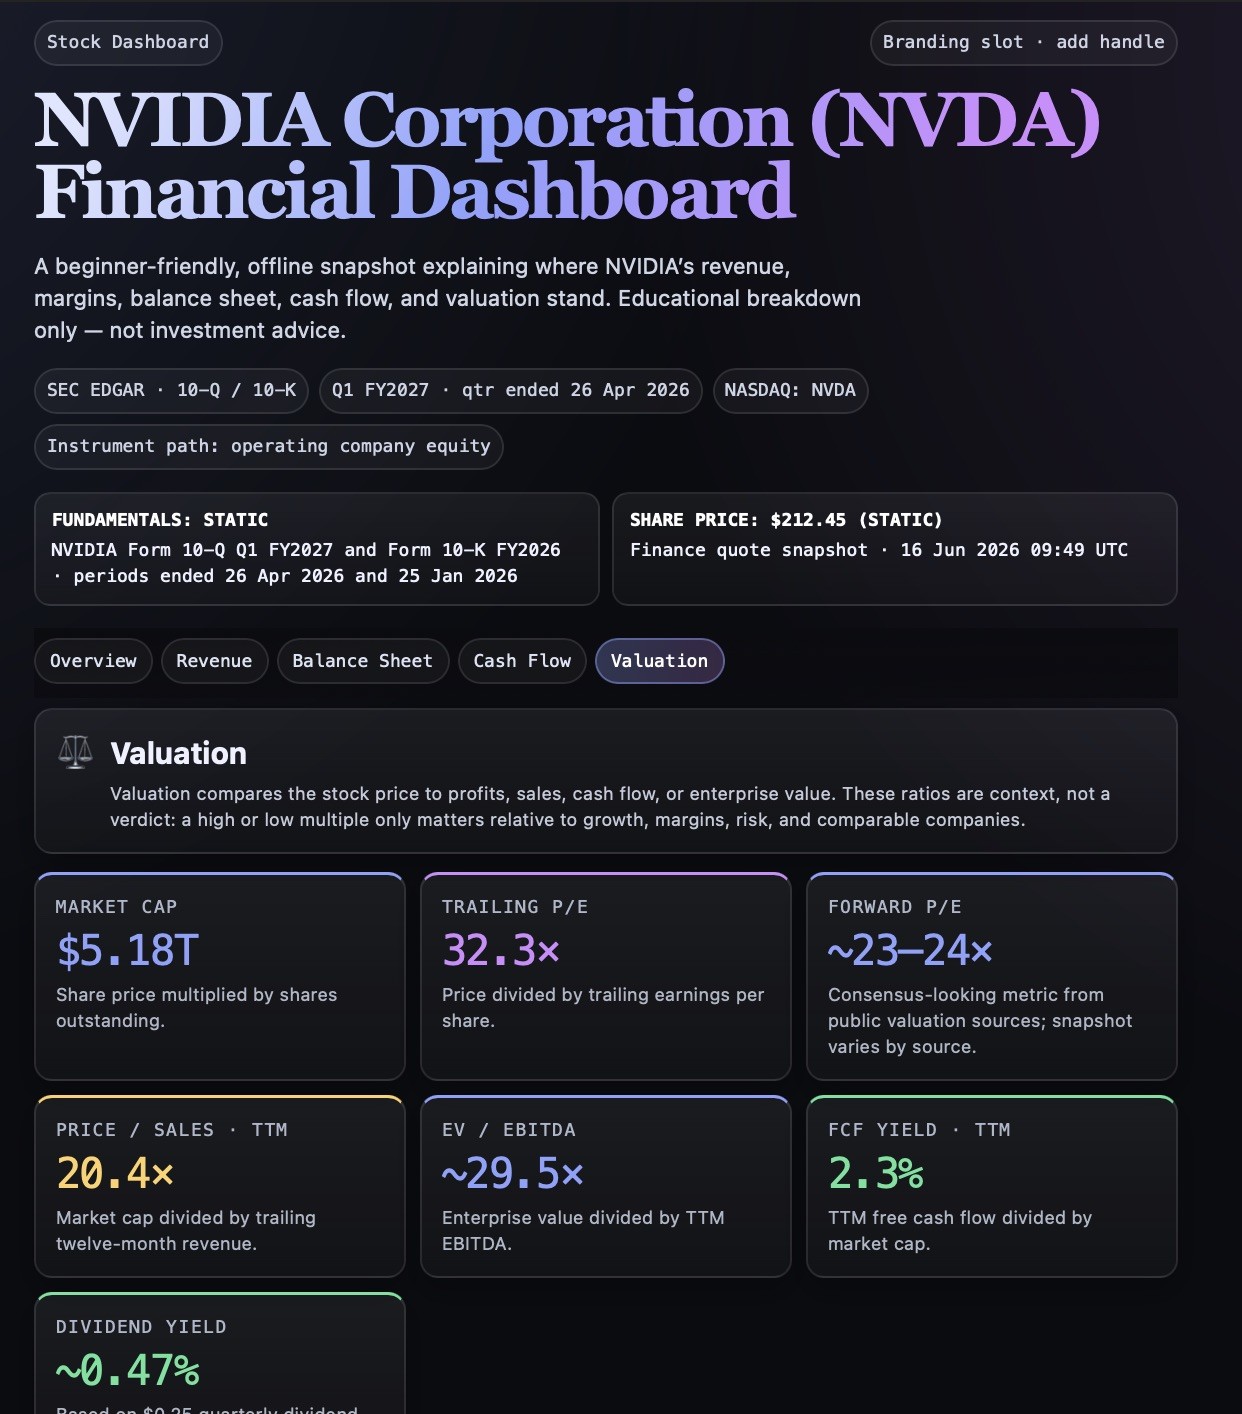
Create an interactive, single-file financial dashboard for {{Company: # Artificial Intelligence, Tesla (TSLA), NVIDIA (NVDA), Microsoft (MSFT), Alphabet (GOOGL), Amazon (AMZN), Meta (META), Apple (AAPL), AMD (AMD), Palantir (PLTR), Intel (INTC), # Pharmaceuticals & Biotech, Pfizer (PFE), Moderna (MRNA), Eli Lilly (LLY), Novo Nordisk (NVO), Johnson & Johnson (JNJ), Merck (MRK), AbbVie (ABBV), AstraZeneca (AZN), Bristol Myers Squibb (BMY), Novartis (NVS), # Finance & Banking, JPMorgan Chase (JPM), Bank of America (BAC), Goldman Sachs (GS), Morgan Stanley (MS), Citigroup (C), Wells Fargo (WFC), Visa (V), Mastercard (MA), American Express (AXP), # Energy & Automotive, ExxonMobil (XOM), Chevron (CVX), NextEra Energy (NEE), Ford (F), General Motors (GM), Toyota (TM), Rivian (RIVN), NIO (NIO) }}.
This is an educational breakdown, not investment advice. State so once, plainly, and never recommend buy/sell/hold.
Step 0 — Classify the instrument
First determine whether {{Company}} is an operating company (equity) or a fund (ETF / index fund). The schema forks here. State which path you took before producing anything.
Step 1 — Research (do this before drawing anything)
Pull current data. Note its source and reporting period.
- For an equity: Gather latest quarterly and TTM figures (e.g., Q1 FY2026), revenue split by segment, income statement essentials, balance sheet essentials, cash flow essentials, and valuation metrics compared against its 3-5y range and 2-3 named peers.
- For an ETF / fund: Gather issuer, inception date, AUM, expense ratio (TER), tracked index, replication method, domicile, top 10 holdings with weights, sector/geographic allocation, distribution policy, performance, and risk markers.
If a figure cannot be sourced, write 'n/a — not disclosed' rather than estimating.
Step 2 — Build the dashboard
Produce one self-contained HTML artifact: inline CSS + vanilla JS, no external dependencies, works offline. Tabbed navigation via JS only (no page reload), mobile-readable.
Header (both paths), in this order:
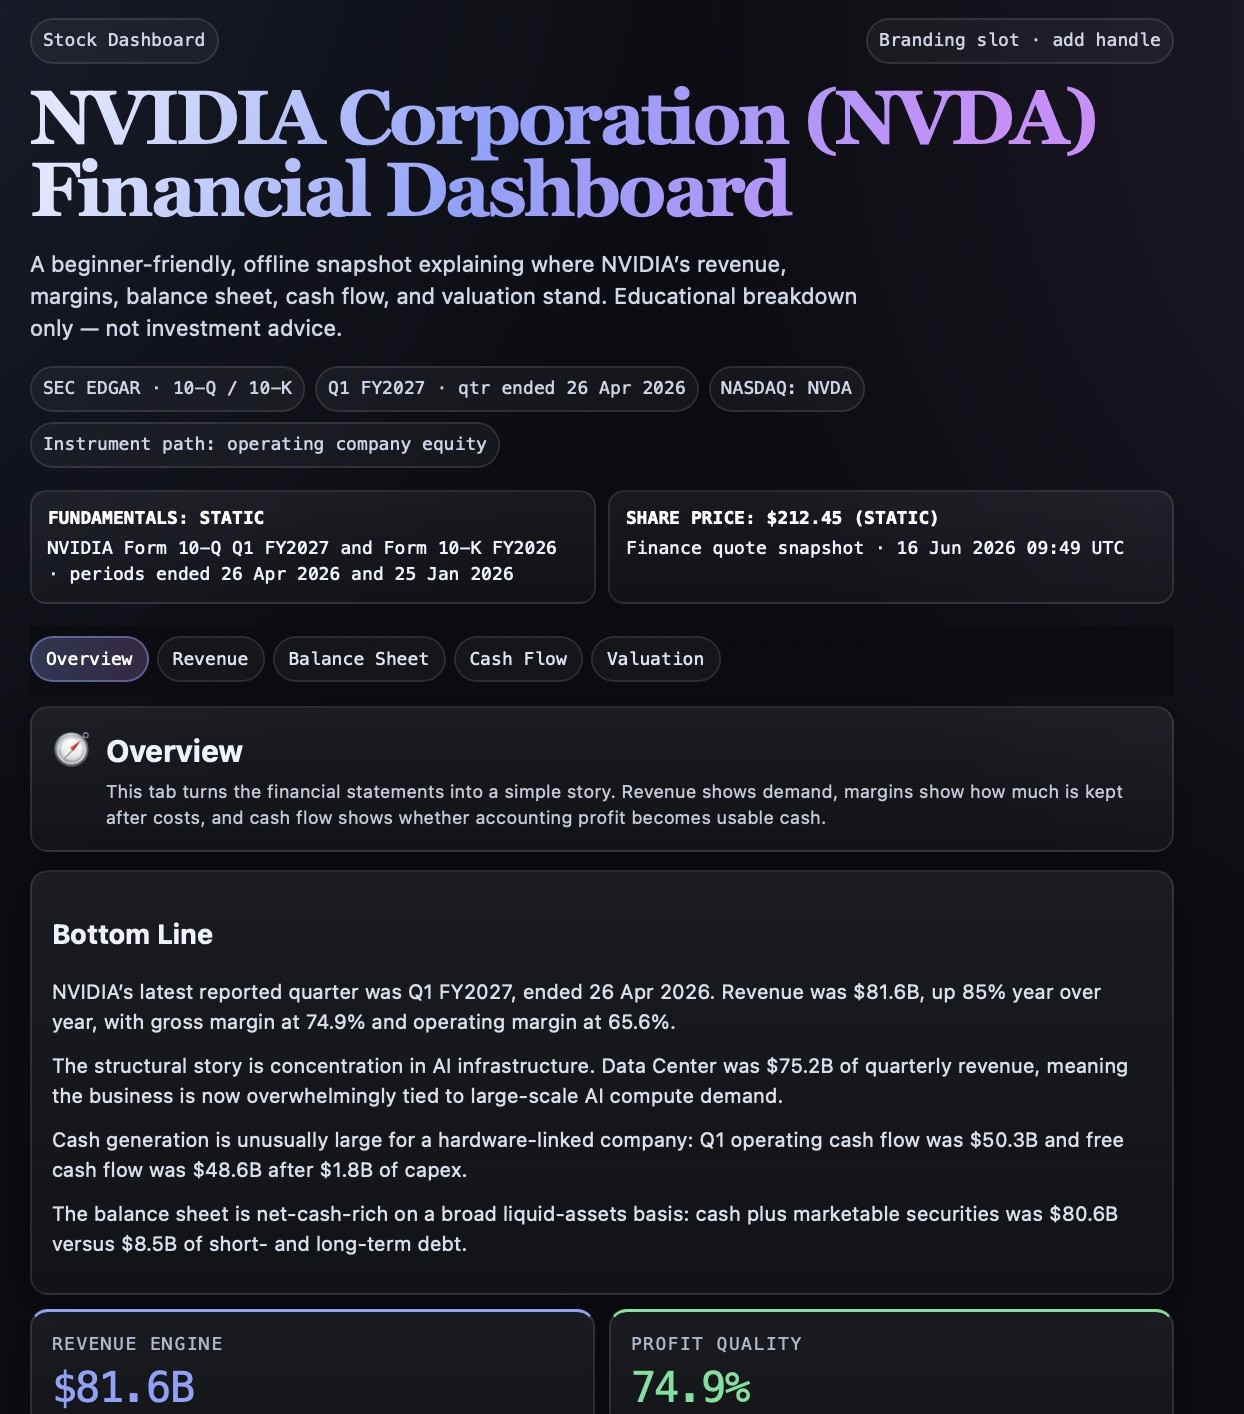
- Small pill badge ('Stock Dashboard' or 'Fund Dashboard'), large title '[Company/Fund name] ({{Company}}) Financial Dashboard', and a one-line plain-English subtitle.
- Monospace metadata pills for data source, reporting period, and listing.
- A data-honesty bar with two separated items: 'Fundamentals: static — [source], [period]' and 'Share price: $[x] (static)' to explicitly state both are snapshots.
Each tab must open with a short plain-English explainer card (one icon, 2-4 sentences) defining the terms used.
Tabs for an equity (five, in this order):
1. Overview — narrative 'Bottom Line' summary, 2x2 grid of insight cards, and an amber risk/regulatory caveat callout.
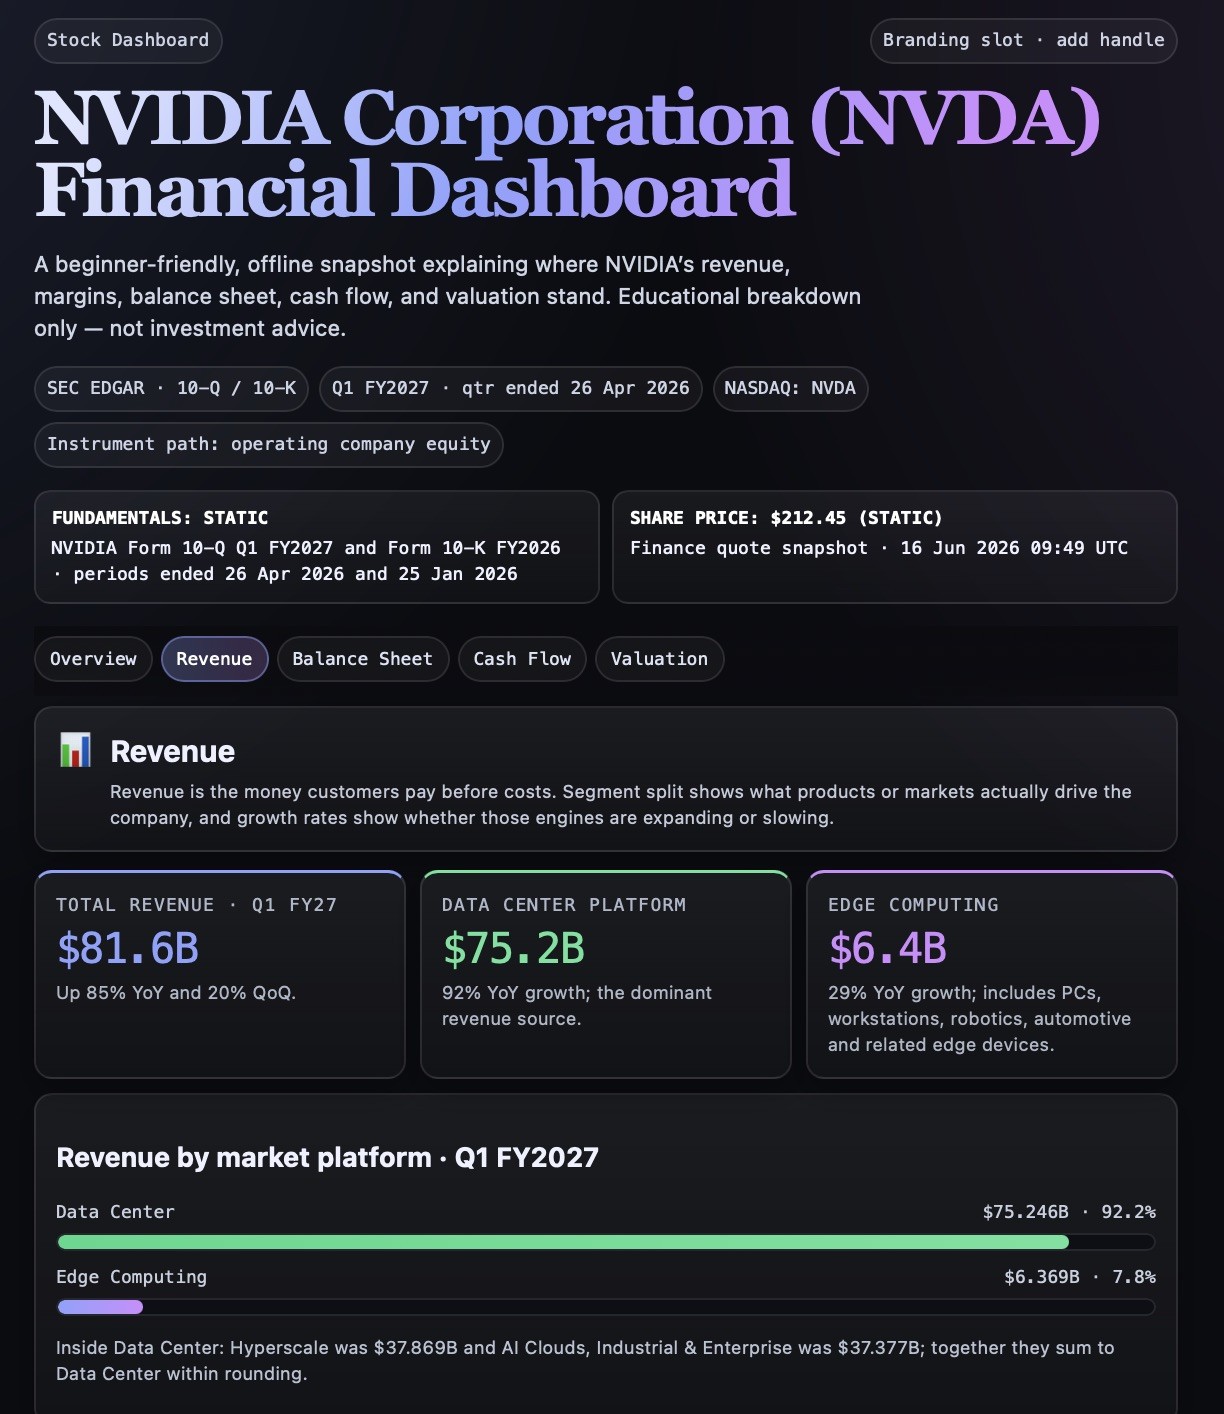
2. Revenue — segment split, growth rates, and source of revenue.
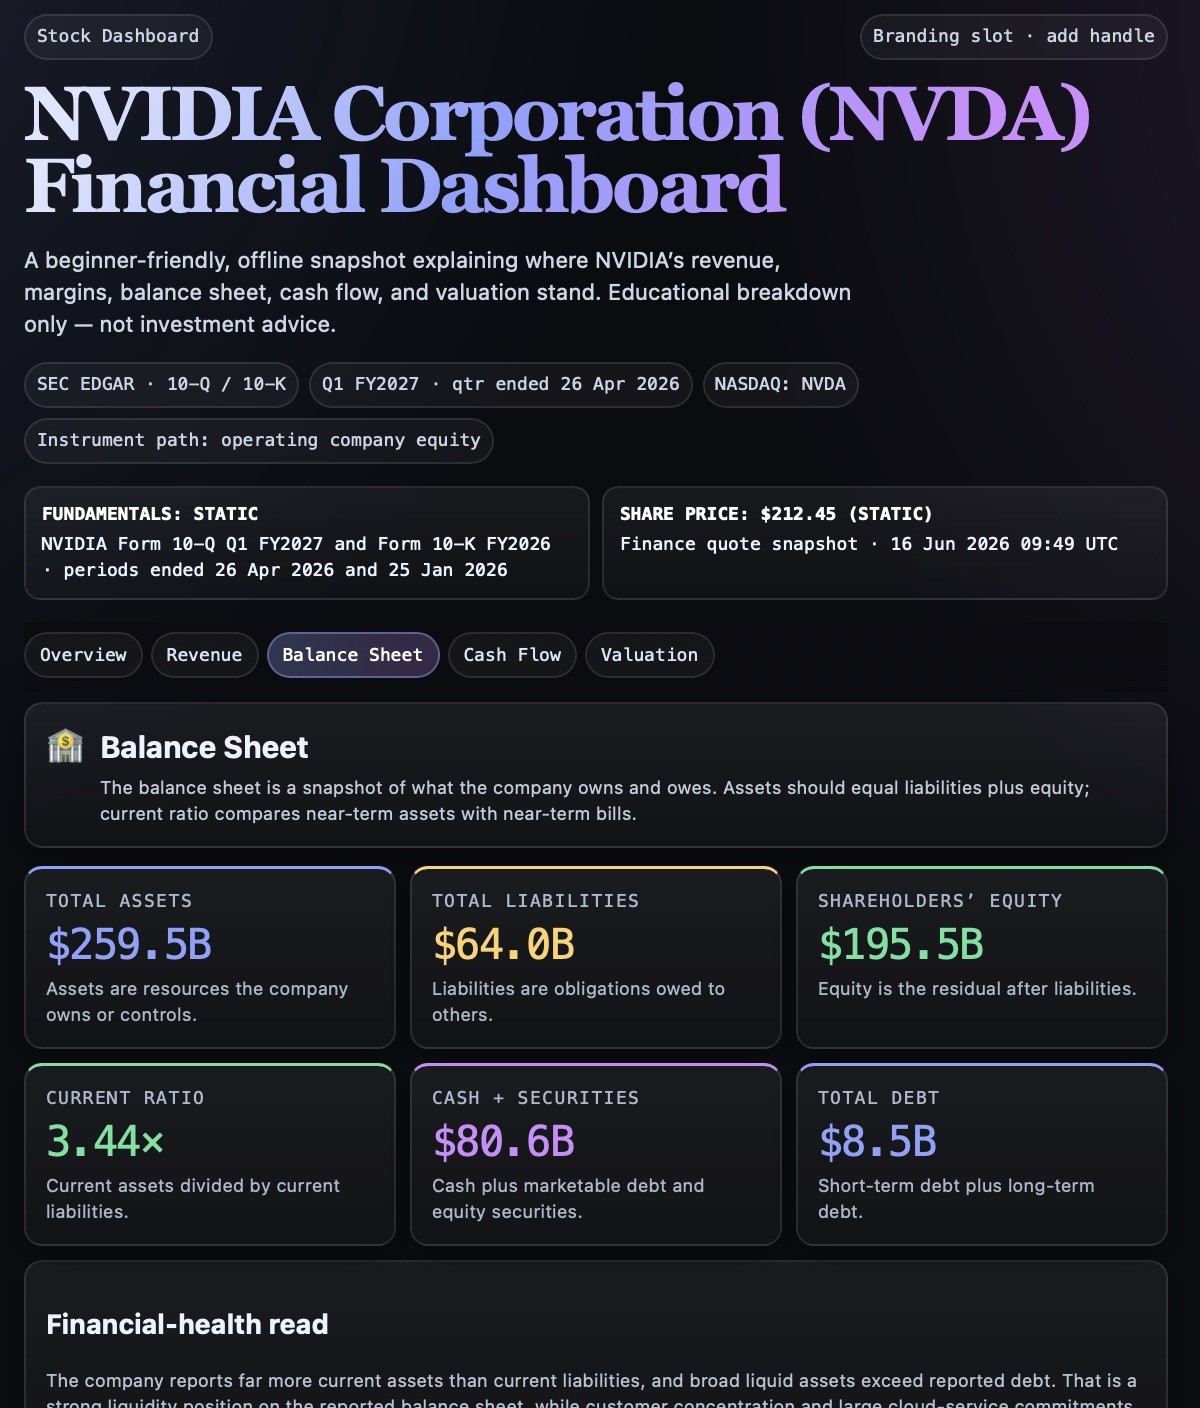
3. Balance Sheet — assets, liabilities, equity, debt vs cash, and financial-health read.
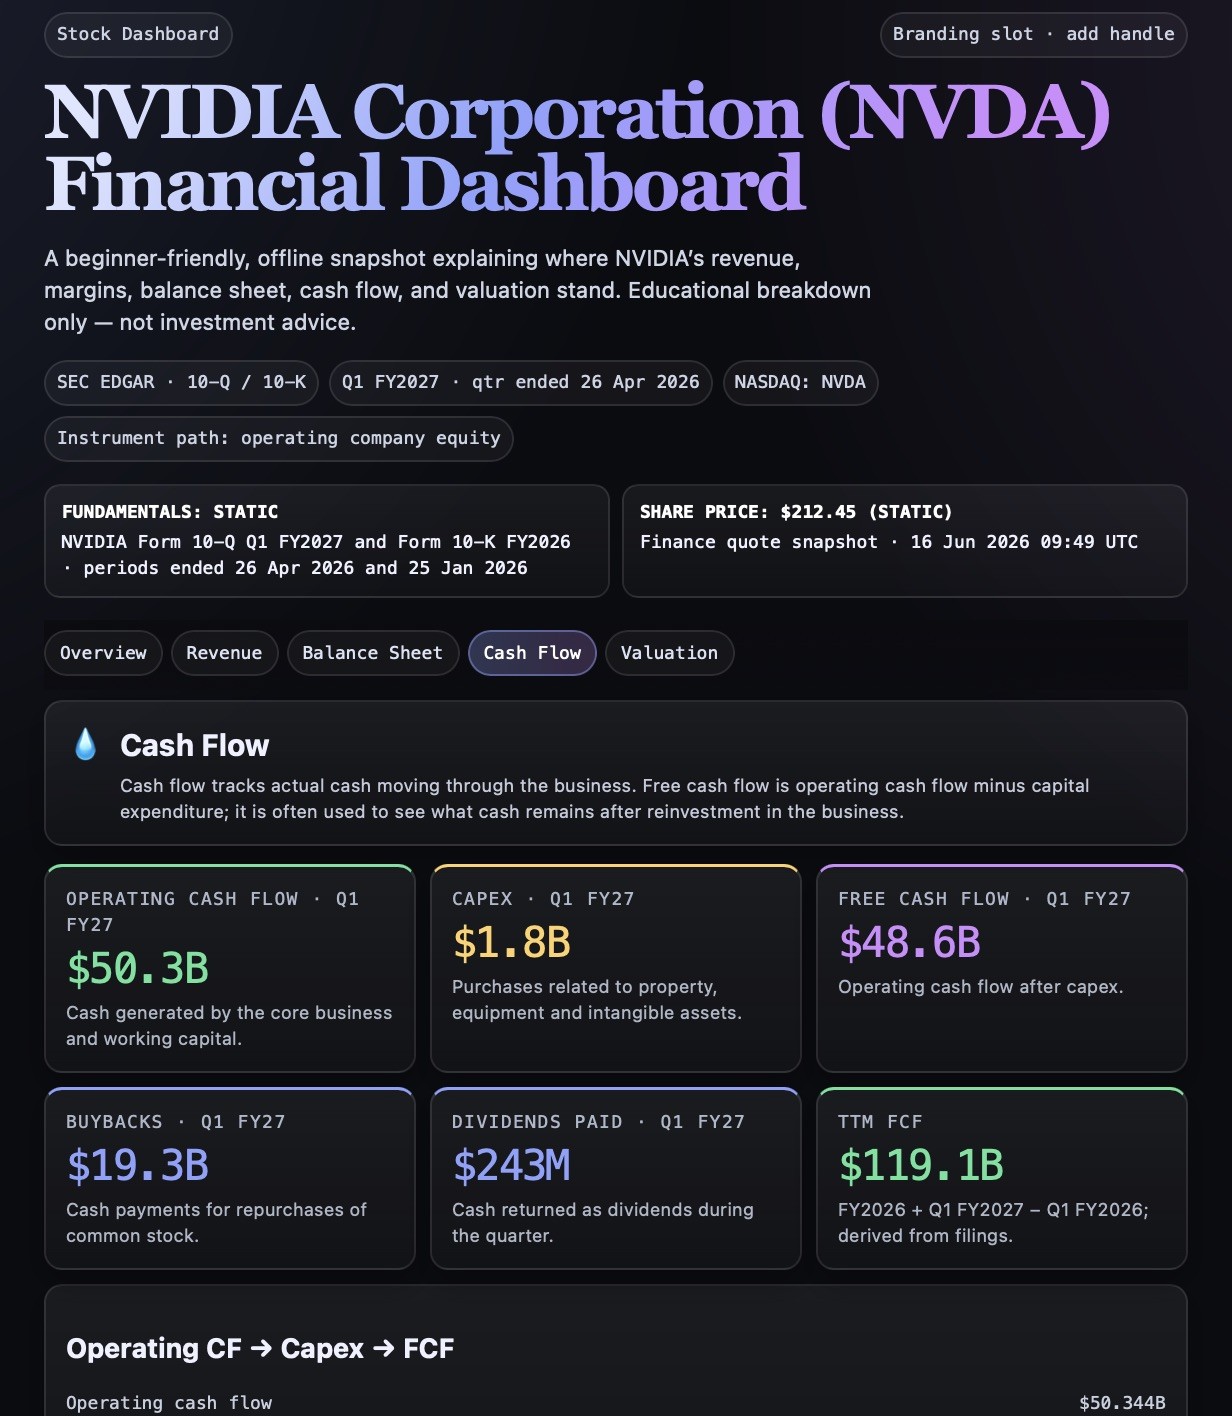
4. Cash Flow — operating CF, capex, FCF, and capital allocation (buybacks/dividends).
5. Valuation — KPI cards against company history and peers with a plain-language context note.
Tabs for an ETF (five, in this order):
1. Overview — bottom-line narrative, insight-card grid, and risk callout.
2. Holdings — top 10 with weights, concentration read.
3. Allocation — sector and geographic breakdown.
4. Performance — trailing returns, tracking difference.
5. Costs & Risk — TER drag over time, distribution policy, volatility/drawdown, and honest exposure summary.
Design and tone rules:
- Visuals: Near-black background (#0b0c10), generous whitespace, large corner radius (~16-20px), hairline borders. Serif display title with a soft blue-to-purple gradient. Sans-serif for body, monospace for metrics and labels.
- Accent palette: Periwinkle-blue (primary), purple/magenta (secondary), green (positive/yield), amber (warnings).
- Tone: Education-only. Provide context, not a verdict.
Verification:
- Verify segment revenues sum to total revenue.
- Verify the balance sheet balances (assets = liabilities + equity).
- Ensure every on-screen figure is traceable.
- Ensure tab switching works with JS only.
State explicitly which checks passed before presenting the code.
# Artificial Intelligence, Tesla (TSLA), NVIDIA (NVDA), Microsoft (MSFT), Alphabet (GOOGL), Amazon (AMZN), Meta (META), Apple (AAPL)
Create an interactive, single-file financial dashboard for # Artificial Intelligence.

This is an educational breakdown, not investment advice. State so once, plainly, and never recommend buy/sell/hold.

Step 0 — Classify the instrument
First determine whether # Artificial Intelligence is an operating company (equity) or a fund (ETF / index fund). The schema forks here. State which path you took before producing anything.

Step 1 — Research (do this before drawing anything)
Pull current data. Note its source and reporting period.
- For an equity: Gather latest quarterly and TTM figures (e.g., Q1 FY2026), revenue split by segment, income statement essentials, balance sheet essentials, cash flow essentials, and valuation metrics compared against its 3-5y range and 2-3 named peers.
- For an ETF / fund: Gather issuer, inception date, AUM, expense ratio (TER), tracked index, replication...
ตัวแปรจะอยู่ภายใน {{ และ }} และเป็นไปตามรูปแบบนี้:
ตัวเลือกสามารถอ้างอิงรายการตัวแปรที่กำหนดไว้ล่วงหน้าโดยใช้วงเล็บเหลี่ยม ตัวเลือกเหล่านี้จะแสดงเป็น[สีส้ม]และให้ค่าที่ใช้บ่อย เช่น สี โทน หรือภาษา
คุณยังสามารถระบุรายการตัวเลือกแบบอินไลน์ โดยคั่นด้วยเครื่องหมายจุลภาคได้
เคล็ดลับ: คุณไม่จำเป็นต้องใช้แอป PUCO เพื่อใช้พรอมต์เหล่านี้! เพียงคัดลอกเทมเพลตและแทนที่แต่ละส่วน {{…}} ด้วยข้อความของคุณเองโดยตรงใน ChatGPT, Claude, Gemini หรือผู้ช่วย AI อื่น ๆ